
Key takeaways
Futures gaps form when an asset’s price jumps between the close and open of an exchange session, creating a visible void on candlestick charts.
Read the full summary
Futures gaps form when an asset’s price jumps between the close and open of an exchange session, creating a visible void on candlestick charts. CME Bitcoin futures gaps fill roughly 77% of the time, with gaps under $500 filling at 85% within 1-2 weeks and gaps under $700 filling at 92% within 30 trading days. Four gap types exist (common, breakaway, runaway, exhaustion), each requiring different trading strategies. Common and exhaustion gaps fill with high probability while breakaway and runaway gaps often stay open for months. Prop firm drawdown type matters for gap trading because intraday trailing drawdowns (used by Apex Trader Funding) can stop you out during normal retracements, while End-of-Day (EOD) drawdowns (used by Tradeify and Topstep) give gap trades room to develop. Tradeify Select offers a $50K account with a $2,500 profit target, $2,000 EOD trailing drawdown, 4 minis or 40 micros, 3-day minimum, 40% consistency rule on eval only, $0 activation fees, 90% profit split, and Elite Accelerator Reward Pools worth $4,000-$12,000 per live account.
The Reality of Trading Futures Gaps

You are staring at your charts on a Sunday evening. The market has been closed since Friday afternoon. You have your coffee ready, your trading platform open, and you are waiting for the bell to ring. Suddenly, the market opens, and the price jumps $700 higher than where it closed on Friday. You are looking at a massive blank space on your candlestick chart.
You just spotted a futures gap.
For retail traders, gaps can look like terrifying chart anomalies. For professional futures traders, gaps look like pure opportunity. Gaps represent a dislocation in price, an area where supply and demand became so imbalanced during off-hours that the market had to leap to a new price level just to find equilibrium.
If you are trading futures markets (whether you are scalping the E-mini S&P 500, swinging crude oil, or handling the wild swings of Bitcoin futures) you have to understand how gaps form and what causes gaps in the first place. More importantly, you need to know how to trade them. Trading gaps requires capital, conviction, and a proprietary trading firm that gives your trades room to breathe.
In this guide, we are breaking down everything you need to know about futures gaps. We will cover the mechanics of how they form, the statistics behind why they fill, and how you can use a prop firm like Tradeify to turn these chart anomalies into consistent payouts.
What Futures Gaps Are and How They Work

A gap in trading is simply a break or space between two trading periods where no trading activity took place on that specific exchange. It happens when an asset opens at a significantly different price level than its previous closing price.
To understand why gaps happen in the futures markets, you have to understand the clock.
Traditional financial markets operate on strict schedules. The Chicago Mercantile Exchange (CME), which hosts the most heavily traded futures contracts in the world, is not open 24/7. Generally, CME futures start trading every Sunday at 5:00 PM Central Time (CT) and close the following Friday at 4:00 PM CT. During the week, there is a daily 60-minute maintenance break from 4:00 PM to 5:00 PM CT.
A lot can happen while the CME is closed.
Geopolitical events occur. Earnings reports drop. Weekend news breaks. Cryptocurrency spot markets continue to trade aggressively. When the CME finally reopens, the price must immediately adjust to account for all the new information and trading activity that occurred globally while its doors were shut.
If the new fair market value is vastly different from the Friday closing price, the opening print will jump. That jump creates a visible blank space on your candlestick chart. That is your futures gap.
The Four Main Types of Futures Gaps

Not all gaps are created equal. If you try to trade every single gap the exact same way, you are going to destroy your account. Before you risk a single dollar of prop firm capital, you must be able to classify the gap you are looking at.
Market technicians categorize gaps into four distinct types.
Common Futures Gaps
Common gaps are exactly what they sound like: common and largely uneventful. They frequently appear in range-bound futures markets or during periods of very low trading volume.
A common gap might form when a stock goes ex-dividend, or when there is a minor overnight price fluctuation that does not fundamentally alter the market’s structure. These gaps are also referred to as “trading gaps” or “area gaps.”
Here is the most important thing to know about common gaps: they almost always get filled, and they usually get filled quickly. Because they do not represent a major shift in market sentiment, the price action tends to drift back and cover the empty space within a few hours or a few days. If you are a day trader using a $50,000 Tradeify account, fading a common gap for a quick scalp is a bread-and-butter setup.
Breakaway Futures Gaps
Breakaway gaps are the ones that destroy amateur traders.
A breakaway gap occurs when the price violently jumps over a major support or resistance level. This is not a random weekend fluctuation. This is a massive shift in market psychology, usually triggered by a major news event, a surprise economic data release, or heavy institutional volume stepping into the futures markets.
When a breakaway gap forms, it signals the start of a brand new trend. The gap point itself instantly turns into a new structural support or resistance level.
Do breakaway gaps get filled? Usually, no. The breakaway gap is the one type of gap that typically does not get filled immediately. The price trades aggressively away from the gap. The larger the breakaway gap, and the stronger the subsequent trading volume, the more violent the new trend will be. If you try to fade a breakaway gap expecting a quick fill, you will likely hit your maximum loss limit and fail your prop firm evaluation.
Runaway Futures Gaps
Runaway gaps, also known as continuation or measuring gaps, happen right in the middle of an established, powerful trend.
Imagine the Nasdaq is in a massive, multi-week uptrend. Buyers are in total control. Suddenly, overnight, positive economic news hits. When the futures market opens, the price gaps up yet again, accelerating in the direction of the underlying trend. That is a runaway gap.
Runaway gaps confirm that the current trend has incredible strength and that institutional volume is still aggressively pushing the market. Trying to trade a gap fill on a runaway gap is incredibly high-risk and should be avoided. Instead, smart traders use runaway gaps as confirmation to add to their winning positions or to enter trend-following trades.
Exhaustion Futures Gaps
Exhaustion gaps are the final gasp of a dying trend.
These gaps occur at the very end of a massive directional move, often near extreme support or resistance levels. After weeks of buying, the last remaining retail traders finally give in to the FOMO (Fear Of Missing Out) and buy aggressively at the open, causing the price to gap up.
However, the “smart money” uses this sudden spike in liquidity to unload their positions. You will often see an exhaustion gap form, immediately followed by a Doji candle or a pinbar, signaling massive rejection. The trend stalls. Shortly after, the price reverses entirely.
Exhaustion gaps almost always get filled, and they serve as an incredible warning sign that a massive market reversal is imminent.
The CME Bitcoin Futures Gap Phenomenon

If you want to see gap theory play out in real-time with massive volatility, you need to look at Bitcoin futures. The “CME Bitcoin Gap” has become one of the most famous and highly debated technical phenomena in modern trading.
Bitcoin is a unique asset because the underlying spot market operates 24 hours a day, 7 days a week, 365 days a year. Crypto exchanges never close. However, institutional investors trade Bitcoin through traditional futures contracts on the CME.
As established earlier, the CME closes on Friday at 4:00 PM CT and does not reopen until Sunday at 5:00 PM CT. During that 49-hour weekend window, the Bitcoin spot price can move thousands of dollars. When the CME finally boots up its matching engines on Sunday evening, the futures price has to instantly teleport to match the current spot price.
This creates massive, highly visible gaps on the CME Bitcoin futures chart.
CME Bitcoin Futures Gap Fill Statistics
Traders obsess over CME Bitcoin gaps because they represent highly actionable trading targets. The “Gap-Filling” theory suggests that Bitcoin has a magnetic tendency to eventually return to the exact price level where the gap formed.
Is this a myth, or is it statistical reality? The numbers speak for themselves.
Data tracking all CME Bitcoin futures gaps from 2018 through 2026 reveals that approximately 77% of all CME Bitcoin gaps eventually get filled. That means the price eventually retraces to cover the empty space left on the chart.
However, gap size matters enormously for fill speed.
- Gaps under $500: These are incredibly high-probability setups. Data shows an 85% fill rate, typically closing within 1 to 2 weeks. Normal market volatility easily covers this distance.
- Gaps under $700: These represent the sweet spot for swing traders. Between 2020 and 2025, gaps under $700 filled at an astonishing 92% rate within 30 trading days.
- Gaps over $2,000: These are much lower probability. Massive gaps usually form during extreme trending markets (like the October 2025 rally to $126,000) and can remain open for months, or potentially never fill at all. The remaining 23% of gaps that do not fill quickly fall into this category.
Real-World Example of a CME Futures Gap
Consider the market action from March 2026. The CME Bitcoin futures closed on Friday afternoon near $67,000. Over the weekend, the spot market slowly drifted downward. By Sunday morning, the spot price was hovering around $66,500.
When the CME reopened on Sunday at 5:00 PM CT, it opened at the new spot price. This created a highly visible $500 gap down. Because this was a small gap (under $500), professional traders instantly knew there was an 85% statistical probability that Bitcoin would eventually rally back up to $67,000 to fill that empty space.
Alternatively, consider the massive $730 gap that formed in March 2025. This gap represented roughly 1% of Bitcoin’s price at the time and immediately caught the attention of global trading desks. Institutional traders used this exact gap to assess their weekend risk exposure and adjust their hedging strategies for the upcoming week.
Even more extreme are the massive structural gaps that form during bear markets. In late 2024, crypto analysts actively monitored a massive unfilled CME gap sitting between $77,000 and $80,000. Analysts noted that a standard 25% market correction from cycle highs could easily drag the price back down to the $77,000 level specifically to fill this historic liquidity void.
Why Futures Gaps Get Filled
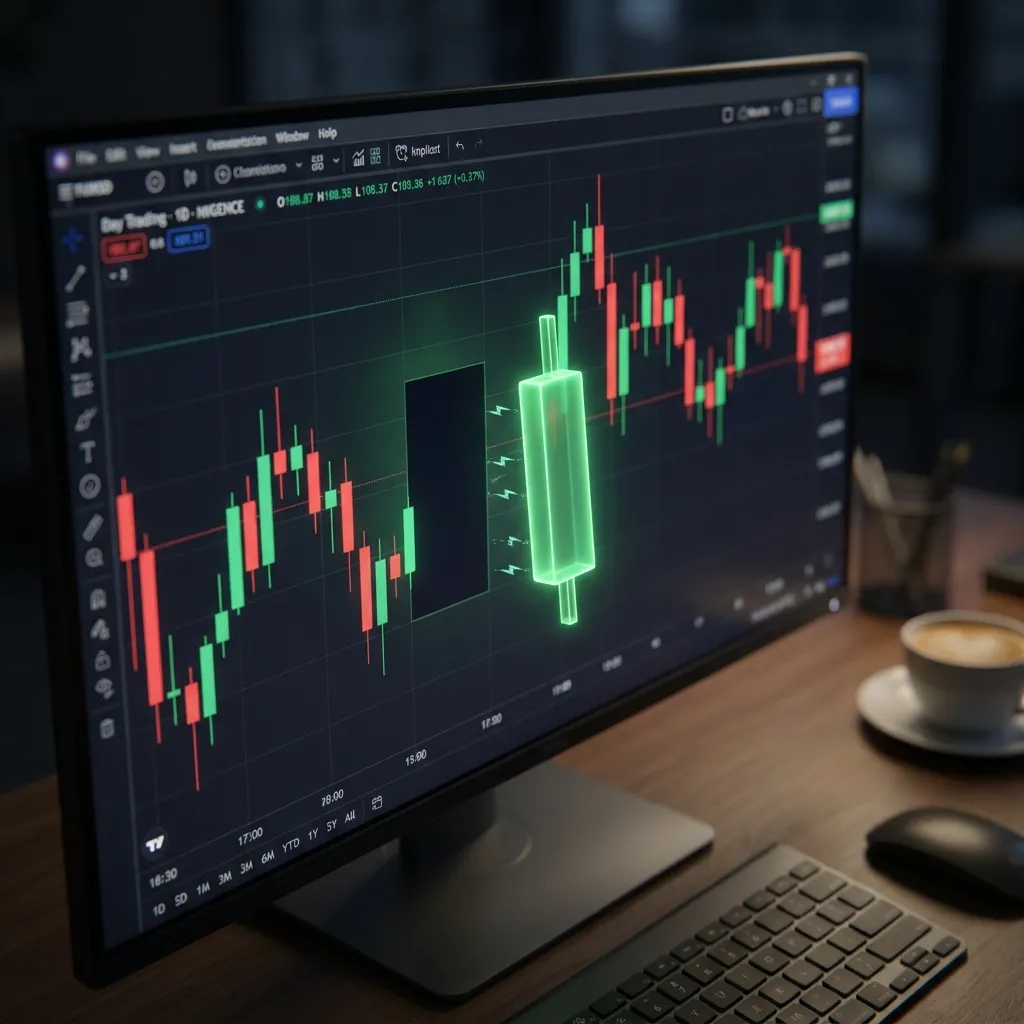
If 77% of Bitcoin gaps and a massive majority of common equity gaps get filled, we have to ask the obvious question: why does this happen? Is it magic? Is it coincidence?
No. It is market mechanics, liquidity, and human psychology.
The Liquidity Vacuum Behind Futures Gaps
During off-hours and weekends, market liquidity is extremely thin. When you trade on a Sunday morning on a crypto spot exchange, there are far fewer buyers and sellers than on a Tuesday afternoon. Because the order books are thin, it takes less capital to move the price significantly.
When Monday morning rolls around and heavy institutional liquidity returns to the market, the weekend price action is often deemed illegitimate or overextended. The heavy institutional volume easily pushes the price back toward Friday’s closing levels to restore balance and true price discovery.
Algorithmic Trading and Futures Gap Fills
We trade in the era of the machines. Institutional trading algorithms are specifically programmed to identify price dislocations and trade toward equilibrium.
A futures gap is a textbook price dislocation. When a gap forms, the density of algorithmic trading in assets like Bitcoin and the S&P 500 means automated systems start firing orders almost immediately. These algos know the statistics. They know the probabilities. They systematically execute trades designed to push the price back into the gap to capture the spread.
Self-Fulfilling Expectations in Futures Gap Trading
Finally, gaps fill because everyone expects them to fill.
Trading is largely a game of mass psychology. Because so many traders (both retail and institutional) know about the 77% fill rate, they actively set their limit orders right at the edges of the gap. This massive concentration of order flow creates real, physical support and resistance exactly where the gap sits.
If thousands of traders are buying a dip specifically because they expect it to rally and fill a gap above, that exact buying pressure is what causes the rally to happen. It is a self-fulfilling prophecy executed by the market order book.
Trading Futures Gaps Using Prop Firm Capital

Now that you understand what gaps are and why they form, we need to talk about execution.
Trading gap fills is a highly profitable strategy, but it requires enduring volatility. When a market opens with a gap, the first hour of trading is usually chaotic. The price might push aggressively in the wrong direction before finally reversing to fill the gap.
If you are trading with your own personal capital, a $1,000 drawdown while waiting for a gap to fill might induce panic. This is why smart traders use proprietary trading firms. Prop firms give you access to simulated capital (anywhere from $25,000 to $150,000) allowing you to trade larger position sizes without risking your personal savings. Some firms even offer instant funding with no evaluation required.
However, choosing the right prop firm is a matter of life and death for a gap trader. You must understand the difference between End-of-Day (EOD) trailing drawdowns and Intraday trailing drawdowns. Risk management, including setting stop-loss orders, is crucial when trading futures gaps with prop firm capital.
The Intraday Trailing Drawdown Trap for Futures Gap Traders
Many popular prop firms, like Apex Trader Funding, utilize an Intraday Trailing Drawdown.
With an intraday trailing drawdown, your maximum loss limit trails your highest open equity in real-time, tick-by-tick. If you enter a gap-fill trade and the price spikes $1,500 in your favor, your drawdown floor instantly moves up by $1,500.
If the market then pulls back $1,000 (a perfectly normal retracement in a volatile morning session) you could breach your trailing drawdown and lose your funded account, even if the trade ultimately goes on to hit your profit target and fill the gap. Intraday trailing drawdowns punish traders for making money and offer zero breathing room for normal price action.
The End-of-Day (EOD) Drawdown Advantage for Futures Gap Trades
If you are trading gaps, you need an End-of-Day (EOD) drawdown. Firms like Tradeify and Topstep use this model.
With an EOD drawdown, your maximum loss limit is calculated solely based on your account balance at the close of the trading day. It does not trail your unrealized open profits tick-by-tick.
This means you can enter a gap trade, experience normal intraday drawdowns, endure the morning volatility, and let the trade play out. As long as you manage your risk and recover before the market closes at 5:00 PM ET, your account is perfectly safe. EOD drawdowns give gap traders the ultimate operational freedom to survive volatility.
Comparing Top Prop Firms for Futures Gap Traders

To trade gaps effectively, you need a firm with straightforward rules, EOD drawdowns, and fast payouts. Here is how the three major players (Tradeify, Topstep, and Apex Trader Funding) stack up in the current 2026 futures markets.
| Feature / Firm | Tradeify (Select Plan) | Topstep | Apex Trader Funding (Intraday) |
|---|---|---|---|
| Drawdown Type | End-of-Day (EOD) | End-of-Day (EOD) | Intraday Trailing |
| Activation Fees | $0 (Free upgrade) | $149 one-time | ~$85 – $145 |
| Daily Loss Limit | None on evaluation | Strict Daily Limits | None |
| Consistency Rule | 40% (Eval only, None on Flex Funded) | None on Funded | 30% (Applies to Funded) |
| Max Accounts | Up to 5 | Up to 5 | Up to 20 |
| Profit Split | 90% to Trader | 100% of first $10k, then 90% | 100% of first $25k, then 90% |
The data clearly points to Tradeify Select as the optimal environment for traders looking to fade futures gaps. Topstep offers a solid EOD model but requires a hefty $149 activation fee to transition to a funded account. Apex offers incredible scaling with 20 accounts, but the intraday trailing drawdown and the 30% consistency rule on funded accounts act as massive hurdles for volatile gap trading.
Tradeify eliminates the activation fee entirely and offers a zero daily loss limit during the evaluation phase, allowing maximum intraday flexibility.
Tradeify Account Breakdown and Rules for Futures Gap Trading

If you are serious about applying gap theory to live futures markets, Tradeify’s Select evaluation is currently the most trader-friendly path to funding.
The Select program uses a unique “evaluate first, commit later” approach. You pass a single-phase evaluation using a unified rule set, and only after passing do you choose your permanent payout structure.
Here are the specific parameters for the highly popular $50,000 Select Account:
- Profit Target: $2,500
- EOD Trailing Drawdown: $2,000
- Max Contracts: 4 Minis or 40 Micros
- Minimum Trading Days: 3 days
During the evaluation, you must adhere to a 40% Consistency Rule. This means no single trading day can account for more than 40% of your total required profit. If you crush a massive breakaway gap and make $2,000 in one day on a $50k account, you simply continue trading smaller sizes on subsequent days to bring your consistency percentage down.
The End-of-Day Futures Gap Drawdown Math
It is crucial to understand exactly how Tradeify calculates the $2,000 EOD drawdown.
The drawdown trails your highest end-of-day balance. If you start a $50,000 account, your initial failure floor is $48,000.
- If you have a great day and close the session at $51,500, your new